In this post, I will cover completing easy sherlocks with splunk.
I haven’t seen many posts covering the tactics they use to ingest sherlocks using splunk, and the posts I have seen for ‘walkthroughs’ offer no reasoning. It’s pretty clear many sherlock writeups just paraphrase from the HTB solution pdf.
So, in this post, I will first go over how I ingest data into splunk, then I will cover how I solve two sherlocks. This focuses on windows event logs.
Splunk config
Surprisingly, there aren’t many docker splunk yamls online. Here’s the one I use.
version: "3.9"

services:
  splunk:
    image: splunk/splunk:latest
    container_name: splunk
    ports:
      - "8000:8000"   # Web UI
      - "8089:8089"   # Management port
      - "9997:9997" #STUPID PORT THAT WASNT OPEN WITH A DEFAULT CONFIG WHO IN THE WORLD GIVES YOU A DEFAULT CONFIG WITH 9997 NOT OPPEN
      - "8088:8088" #Port for http uploads
    environment:
      SPLUNK_GENERAL_TERMS: "--accept-sgt-current-at-splunk-com"
      SPLUNK_START_ARGS: "--accept-license"
      SPLUNK_PASSWORD: "CHANGEME" ###############CHANGE THIS########################
    volumes:
      - splunk_etc:/opt/splunk/etc
      - splunk_var:/opt/splunk/var
    restart: unless-stopped

volumes:
  splunk_etc:
  splunk_var:
Ingesting
Now, I have two ways of ingesting logs into splunk. This first way creates logs that appear nice, but are missing important information. This one was done on a windows machine.
It turns out it’s much more difficult than I thought to ingest already exported evtx logs into splunk.
- Download Splunk forwarder, and point it to your docker splunk.
- Put all of your evtx logs in a folder.
- Add an index for this sherlock.
- Update your inputs.conf, and restart the forwarder.
Here is my inputs.conf.
[monitor://c:\Artifacts\*.evtx]
disabled = false
index = crown1
host = htb-sherlock
crcSalt = <SOURCE>
Adding tags to try to show the extra xml did not work, if anyone found a way to make this work please email me (nathan@nathan2.com)! This would be so much easier. Either way, this forwards events in a simple way that will probably be enough for most easy challenges.
For more difficult challenges, I ingested logs using this command with evtx2splunk. This is a great tool that I hope more people use. You have to configure the .env file when you download it, but after that, it is so much easier.
It also creates the index for you, so you don’t even have to go into splunk and create one first! It’s so nice.
cd ~/Documents/defense/evtx2splunk/ && python3 evtx2splunk.py --input ~/Downloads/Logs --index smartypants
The issue with this is now the logs are in a json format, which makes querying not as easy as the original splunk logs we put into windows.
Many people use hayabusa, but I do not like to use it past the initial command to get an idea of what I might be dealing with. I just ran this command below, and use the base definitions to find what initial log I should start searching for.
~/Documents/defense/hayabusa/hayabusa-3.6.0-lin-x64-gnu csv-timeline -d ~/Downloads/Logs/ -o logs.csv -C
Solving
These next two htb sherlocks are marked very easy, and now lets use our new indexes to find the right answers!
SmartyPants
I ingested the logs using evtx2splunk under the smartypants index.
This directly shows the differences between the two previously discussed log sources. This challenge is impossible with the logs ingested from windows. With this challenge, I ran hayabusa with the previous command, and saw that the log was cleared. The challenge hints at using smartscreen heavily.
- The first question asks: “The attacker logged in to the machine where Dutch saves critical files, via RDP on 24th January 2025. Please determine the timestamp of this login.”.
I first searched for logins with event code 4624 with this query:
index=smartypants Event.System.EventID=4624 | stats count by Event.EventData.TargetUserName,Event.EventData.LogonType
This is the annoying part with json logs, the fact that you must use Event.whatever to reference it. Oh well, they still log just fine. I used stats count to display the username and logon type, but there were no logon types related to RDP.
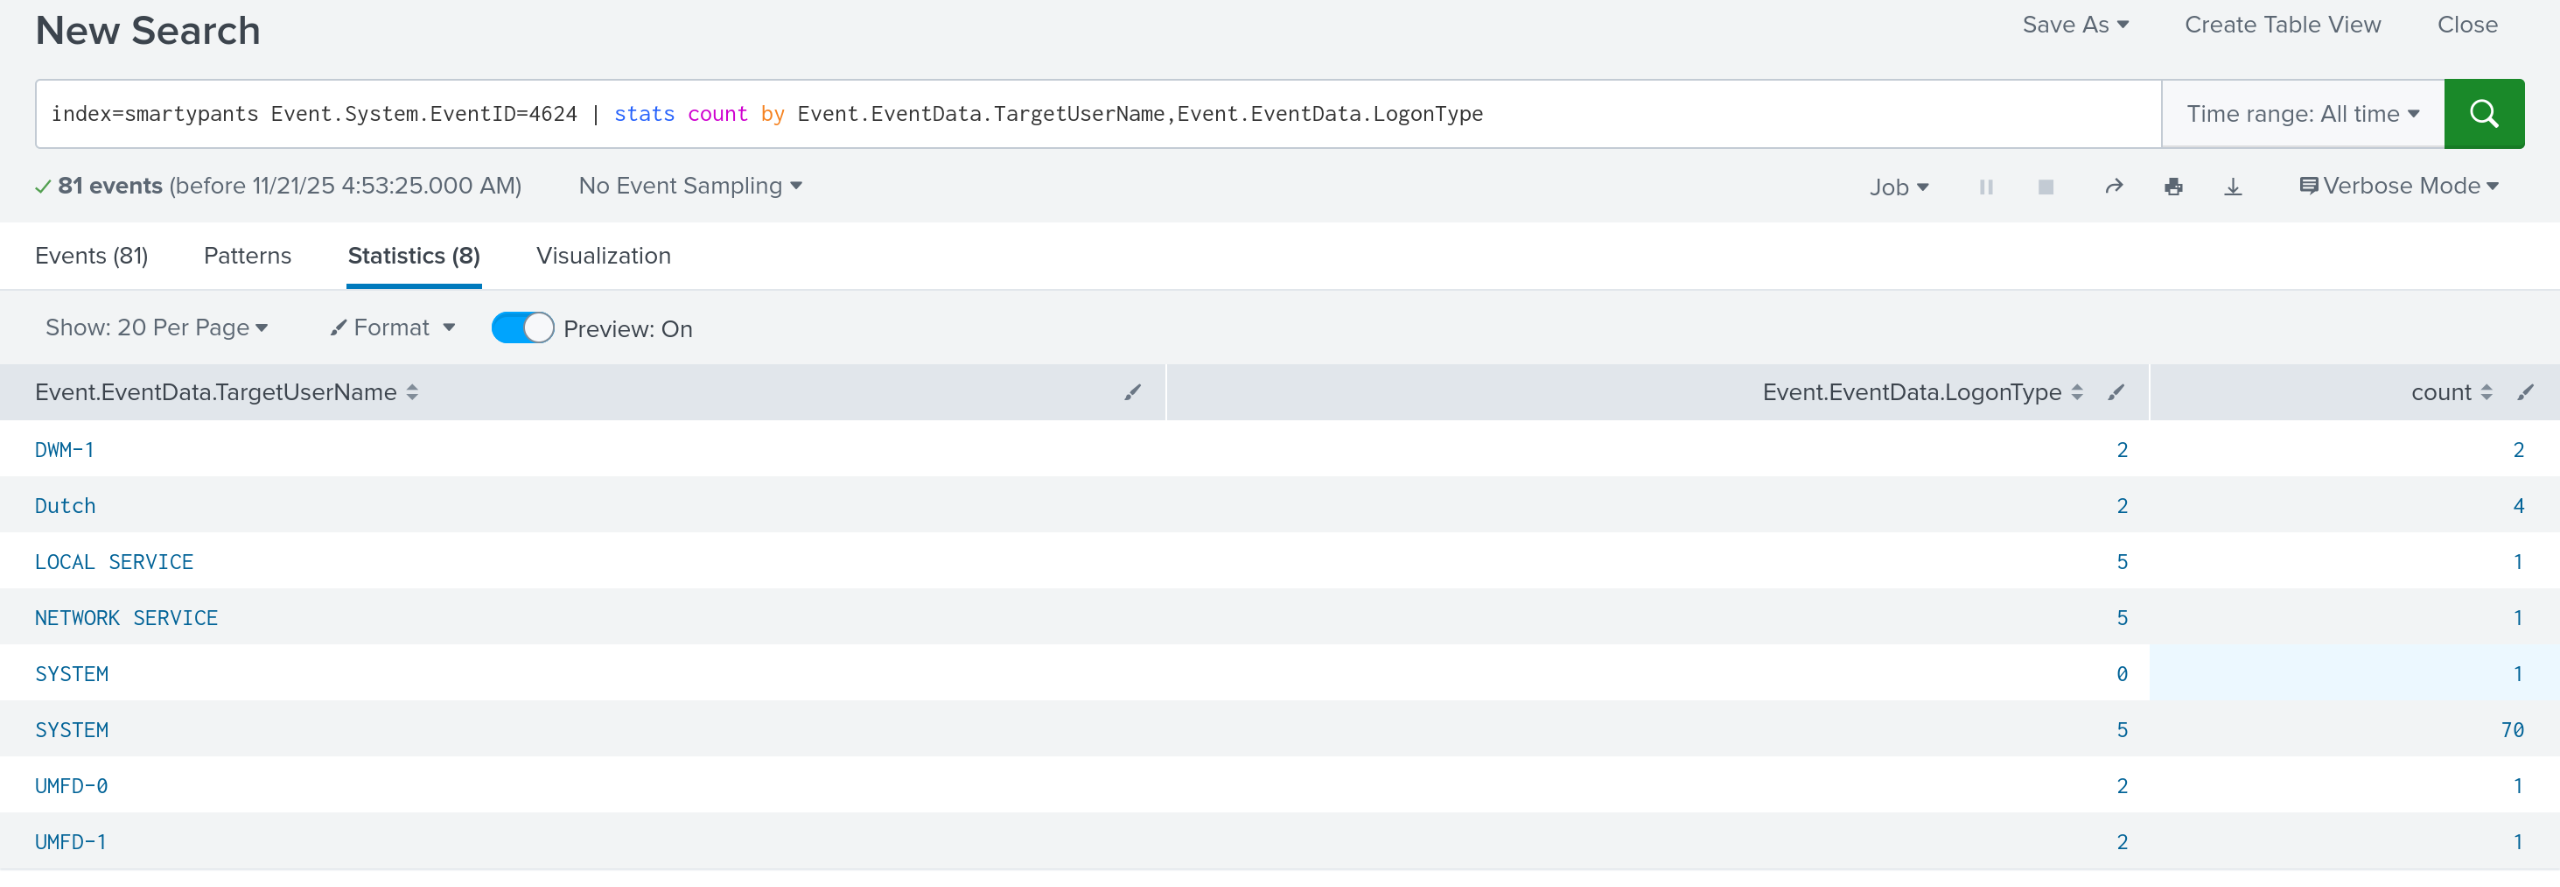 Using google, you can find that there is another event code that records an rdp logon. That event code is 1149. Switching to that event id shows one event, with the timestamp for the answer.
- The second question asks: “The attacker downloaded a few utilities that aided them in their sabotage and extortion operation. What was the first tool they downloaded and installed?”
Remember, many logs are cleared. The challenge hints at using smartscreen. So does the actual question hint. I used this query to search for all exe’s and display the time from smartscreen.
index=smartypants "*.exe" "Microsoft-Windows-SmartScreen/Debug" | table Event.EventData.Data,Event.System.TimeCreated.#attributes.SystemTime
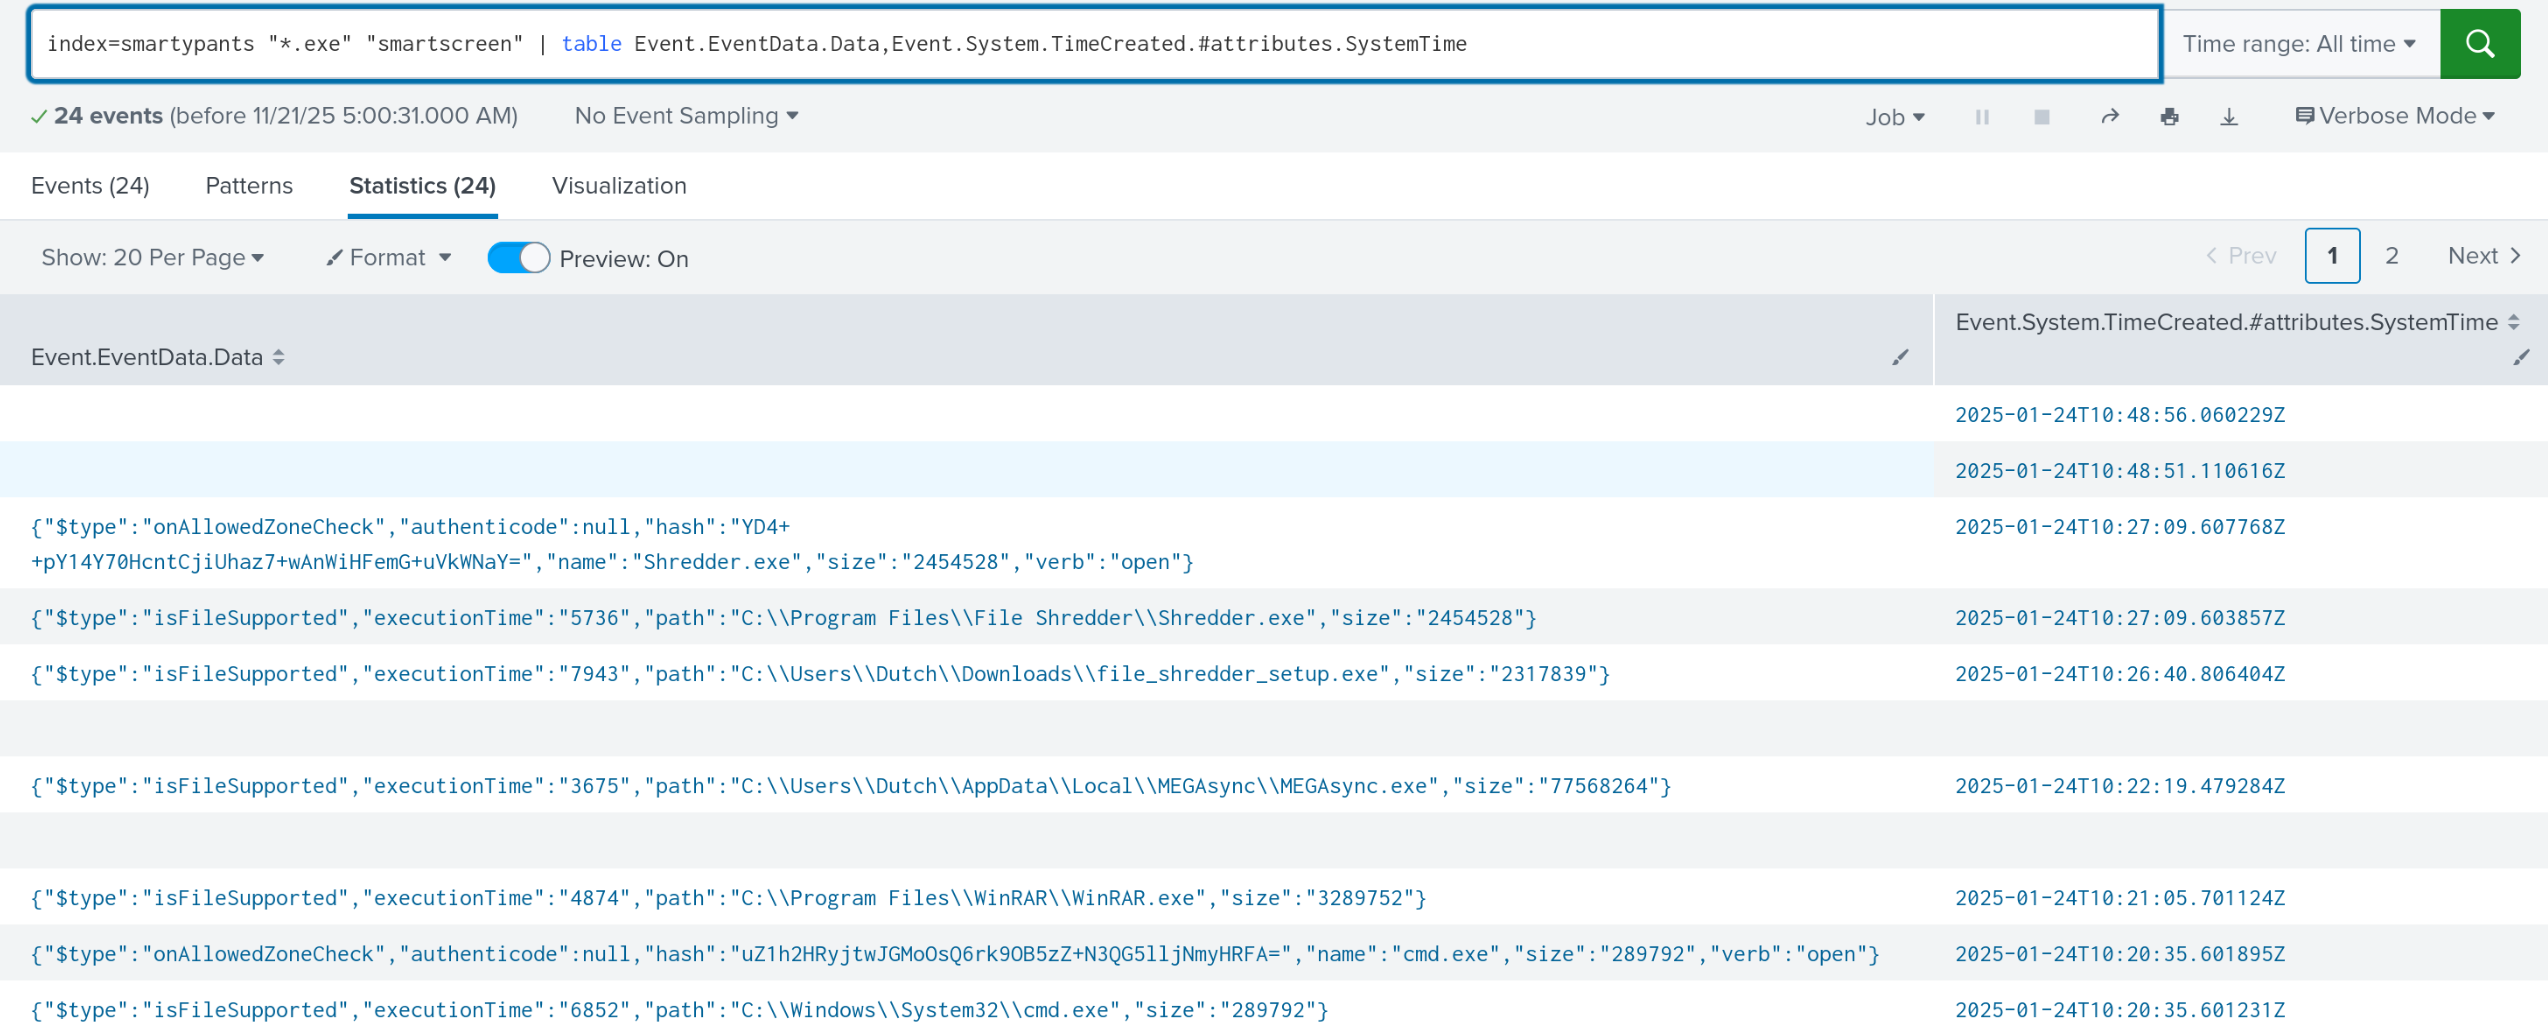 This query also solves questions 3 and 4. Remember, I don’t want to spoil it for everyone :)
- “The utility was used to search for critical and confidential documents stored on the host, which the attacker could steal and extort the victim. What was the first document that the attacker got their hands on and breached the confidentiality of that document?”
In the same way, I queried for documents within smartscreen.
index=smartypants "*Documents*" "Microsoft-Windows-SmartScreen/Debug" | table Event.EventData.Data,Event.System.TimeCreated.#attributes.SystemTime
This solves question 6 as well.
The query from question 2 solves questions 7,8, and 9 also.
- “The attacker cleared 2 important logs, thinking they covered all their tracks. When was the security log cleared?”
To solve this, I looked up the event ID for clearing logs. It also shows in the hayabusa output, as 1102. I simply queried for that event and the security log.
index=smartypants Event.System.EventID=1102 "Security"
I hope this helps with methodology for someone! I think it’s fun to see how many problems can be solved with just a few well-placed queries. To be fair, this is also rated very easy, and htb could have made the smart screen logs more ’loud’ for extra challenge.
Operation Blackout 2025: Smoke & Mirrors
This challenge is much easier and can be solved with just the logs ingested from windows. It’s probably also doable just with hayabusa on the default rules. However, that’s no fun. That’s too easy. Let’s use the json logs to solve this.
- The attacker disabled LSA protection on the compromised host by modifying a registry key. What is the full path of that registry key?
Now, you could solve this by simply searching “LSA” on any log. That’s exactly what I did. I know, it’s cheating. It’s just to get a foothold. It showed up in hayabusa logs anyway.
I ingested these logs into the smokehard index with the evtx2splunk tool.
index=smokehard "LSA" | table Event.EventData.CommandLine
This command allows me to see the command line information, including the answer. More importantly, it gave me the PID the attacker was using. Now we can query by PID to trace this attack back further.
index=smokehard | search "ProcessID": 9808
Returns 606 events. Let’s get more specific and see what this process did.
index=smokehard Event.EventData.CommandLine=* | search "ProcessID": 9808 | table Event.EventData.CommandLine
Here, I used the search function to grab the PID, since it appears differently in different logs. I’m simply searching for any commands with commandline arguments, then displaying all of them.
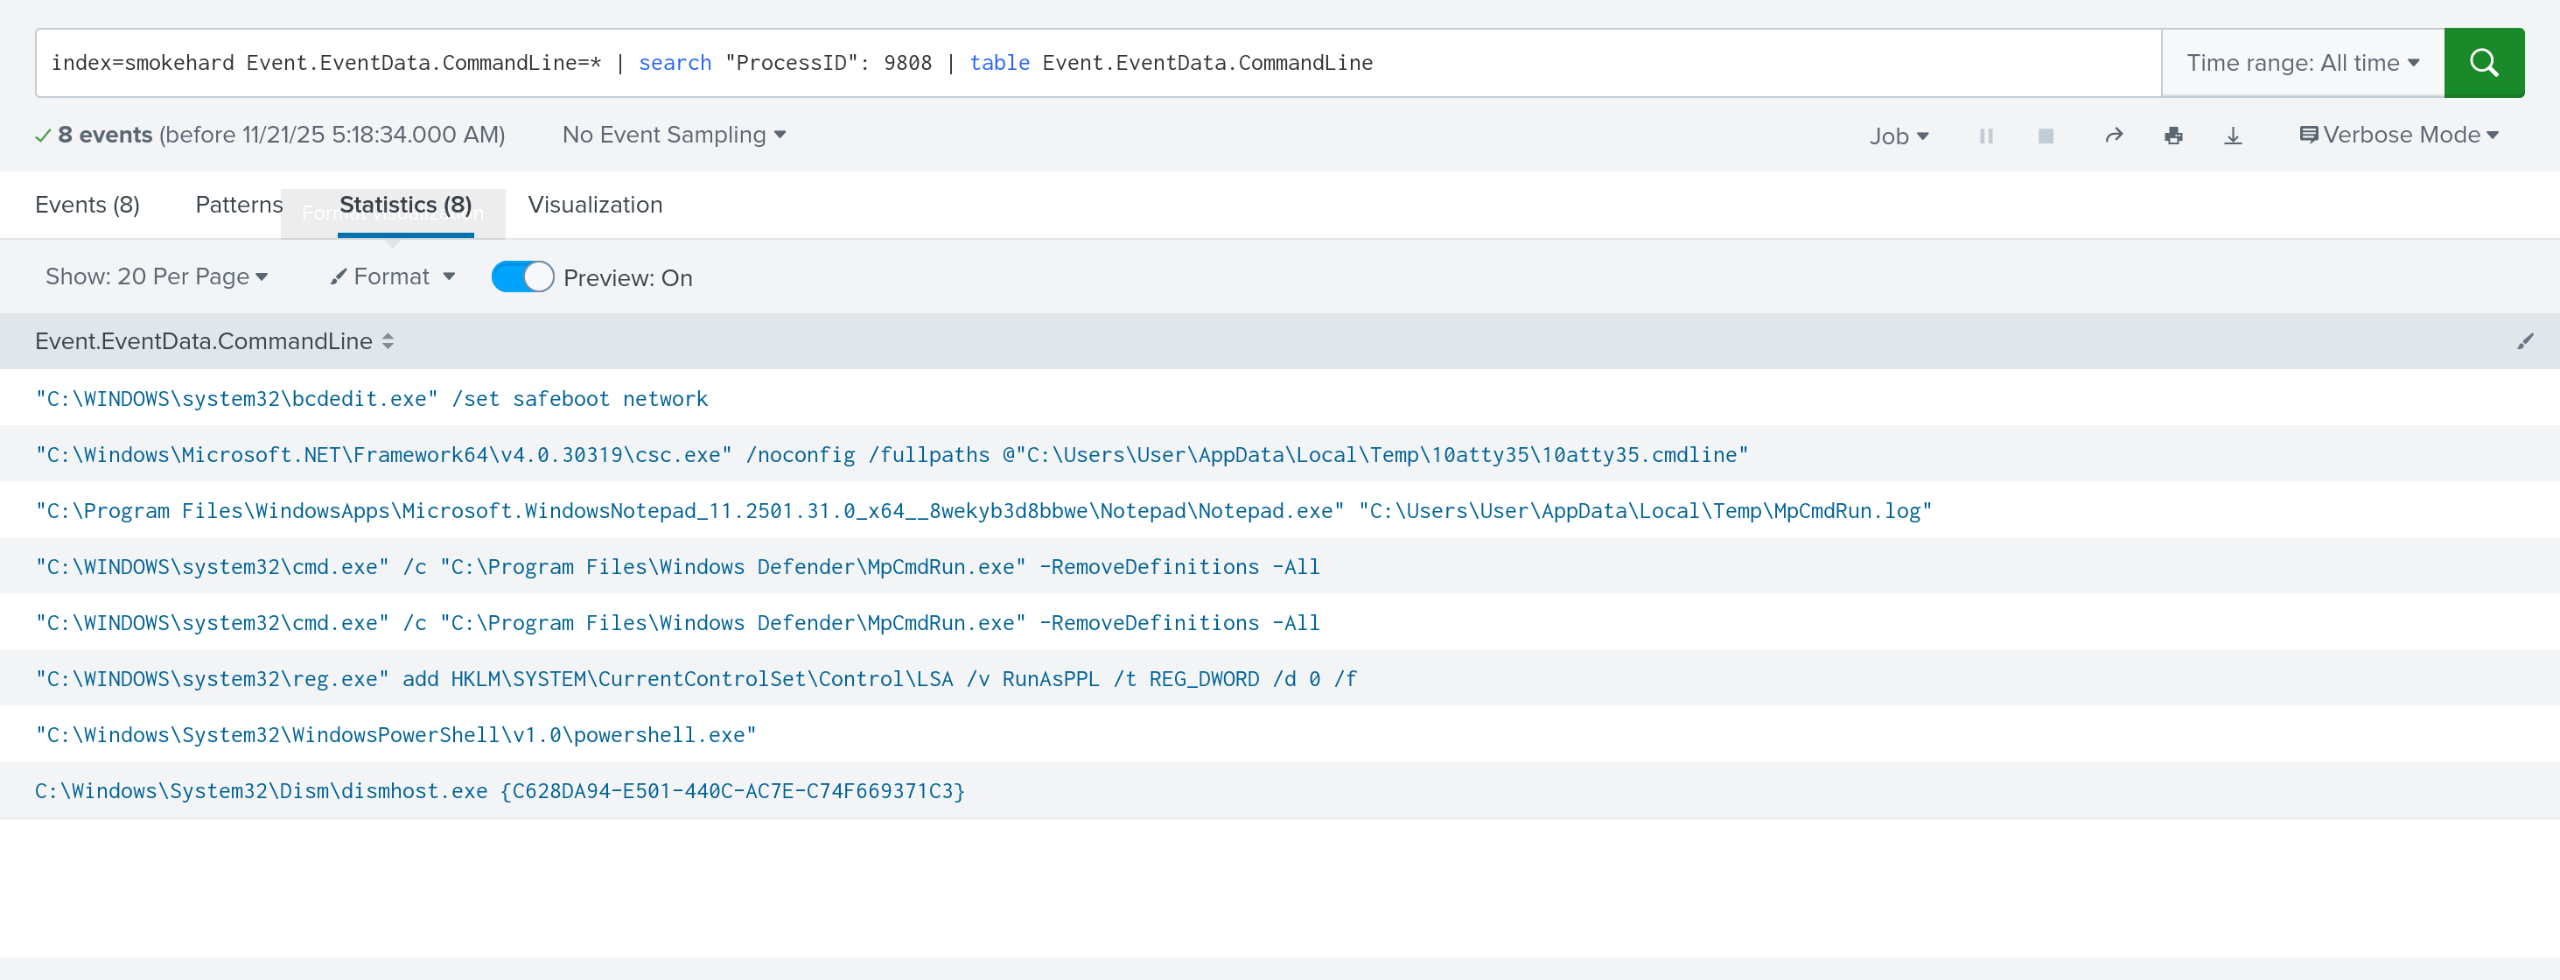 This also displays the answer to question #4.
It also displays that definitions were removed; however this does not count as disabling defender for some reason? Effectively, this is a red teaming strategy to silently ensure defender will not detect new malware.
This also displays the answer to question #4.
It also displays that definitions were removed; however this does not count as disabling defender for some reason? Effectively, this is a red teaming strategy to silently ensure defender will not detect new malware.
- Which PowerShell command did the attacker first execute to disable Windows Defender?
We will now be dealing with scripts, which show up strangely in this ingestion. However, they are not impossible to find. I changed my query after inspecting some more responses to look for set-mp, since this command is used to interface with defender.
index=smokehard
| search "ProcessID": 9808 "*set-mp*"
| table Event.EventData.Data.#text{}
- “The attacker loaded an AMSI patch written in PowerShell. Which function in the DLL is being patched by the script to effectively disable AMSI?”
I searched for all dlls, under the same process. The payload shows the answer.
index=smokehard "*.dll" | search "ProcessID": 9808
|table Event.EventData.Payload
- Which PowerShell command did the attacker use to disable PowerShell command history logging?
In the same way, I queried for all references to history within the same pid.
index=smokehard "*history*" | search "ProcessID": 9808 | table Event.EventData.Payload
Thank you for reading! I hope this helps!